-
Worldwide Patent Filing Trends (All Authorities)
This report covers patent filing trends across a selected set of countries or authorities and goes a level deeper to analyze key technology sectors and characteristics of the applicant within each.
The report is divided into three broad segments: Global patent filing trends (All authorities), Country based patent filing trends (Covering US, China, Germany, Japan, France, Britain and India) and patent filing trends covering the European Patent Office (EPO) and the World Intellectual Property Organization (WIPO).
Patent Application Filing Trends
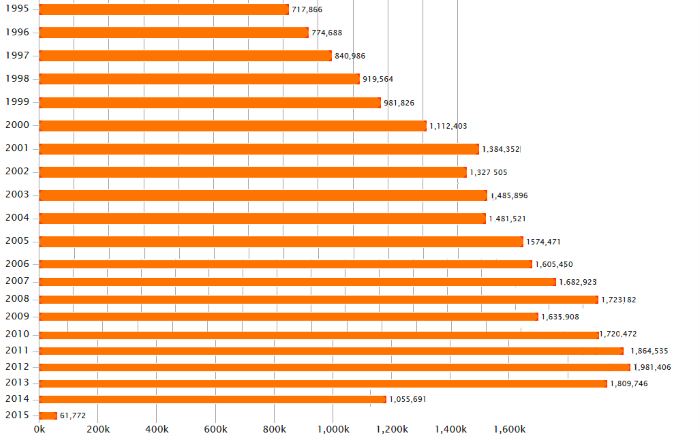
The chart below shows the total number of new patent applications filed annually across 102+ patent offices in the last 20 years.
There is substantial rise in the number of new applications filed in the last three years. The number of patent applications filed in 2013-2014 totaled 4.4 million. This represents roughly 6.2% rise in the applications filed in the previous period between 2011-2012. The long term trends shows continuous growth in the number of applications filed, with the exception of slight decrease during 2007-2008. During the last 20 years total number of applications has tripled from where they were in 1996.

Growth of Filings across Patent Offices
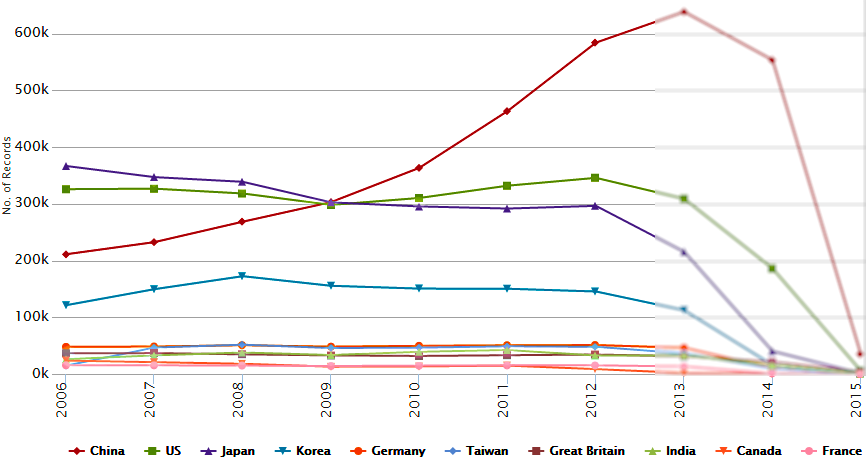
The chart below shows filing trend of top ten countries in the last ten years
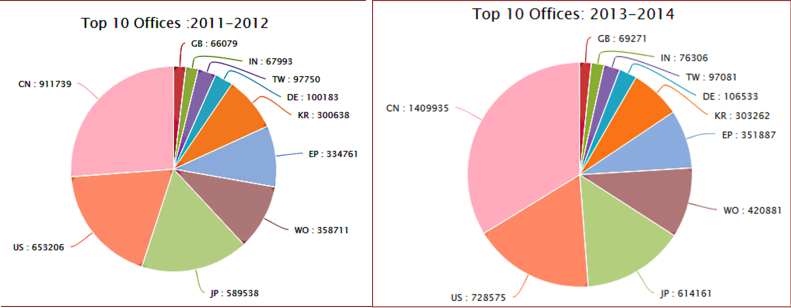
China which at the start of the last decade was at the third place in terms of applications; as compared to others has the maximum rise in patent applications filed in the last ten years with US being nearly equal with Japan in terms of the applications. During 2013-14 the total number of applications has increased by 6, 77,193 over the previous two years. China Patent Office (SIPO) accounts for 31% of the total increase. The United States Patents and Trademark Office (USPTO) and Japan Patent Office (JPO) account for 16.3% and 13.75% respectively of the total increase. This reflects the acceleration of the shift in the geography of applications filed towards Asia. As a result of the high number of applications filed in China, Asia is occupying an important position in IP filing, having received 58.4% of patent applications filed worldwide.

Note: Since filing data is usually not available for some countries for 12-24 months the recent years are not indicative of the actual values.
The charts below show a comparison of total number of applications filed in patent office’s between the periods 2011-12 and 2013-14. The gap between SIPO and other patent office’s has increased over the last five years.

Summary
Growing Patenting Activity:
Worldwide filings of patent applications have grown at a substantial rate i.e. from 12,601,187 applications during the period 1995-2005 to 15,206,132 applications in the subsequent period between 2005-2015, which is nearly an increase of 2.6 million applications. The growth rate is comparable to the overall increase in economic activity over the same period.
The distribution of patent filings worldwide is very uneven. A small number of countries account for the majority of patent filings both by residents and non-residents. Patent offices of China and the United States of America receive the largest amount of patent applications followed by North East Asian emerging States, namely Japan and the Republic of Korea and large industrialized European States. The distribution of patent filings by office has changed in recent years, particularly as China and the Republic of Korea are becoming major industrial economies and their use of the patent system is expanding.
Increasing Internationalization:
The use of patent system internationally has increased markedly in recent years. This can be seen in the growth rate of total patent filings by non-residents and increase in non-resident patent filings in countries such as China, India, Korea and the Russian Federation. However, the use of the patent system remains highly concentrated with only five patent office’s (China, Japan, the European Patent Office, the Republic of Korea and the United States of America) accounting for a major percentage of the total applications.
Worldwide Technology Domain Distribution
Patent applications are filed under different technological domains. Furthermore, tendency of patent applications differ across different technologies, as some technologies depend more heavily on the patent systems than others. In order to understand the activity and trends across technologies, this section presents data by different fields of technology.
As per the trends suggest in the last 5 years, Computer Technology and Electrical Machinery accounted for maximum patent applications filed. These 2 fields have shown substantial growth since last 5 years. The majority of fields have shown continuous growth in applications with Food Chemistry and Telecommunications industry emerging as popular fields of innovation. Filings in Optics, Audio-visual industry have dropped over last decade. Applications for Micro and Nano-structures have shown substantial growth, but overall account for a very small portion of the number of applications.
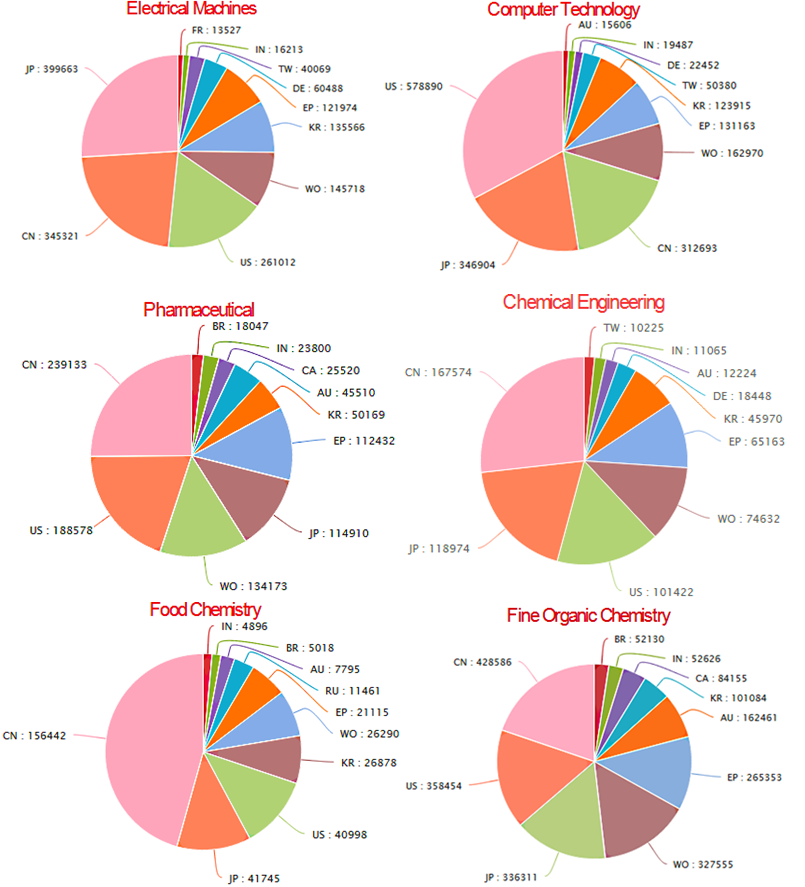
From the multiple domains of technologies we selected Chemical Engineering, Electrical Machines, Pharmaceutical, Telecommunication, Computer Technology and Fine Organic Chemistry for representation purpose as these are the fields under which there is substantial number of applications filed in the last ten years at different patent offices.
Technological Domains No. of Applications Electrical Machines 2366638 Telecommunication 2199036 Pharmaceutical 1686169 Engines/Pumps/Turbines 958386 Transport 1511010 Computer Technology 2722389 Food Chemistry 542243 Chemical Engineering 1142879 Medical Instruments 1488060 Organic Fine Chemistry 2512183 Note: The IPC to Technology correspondence is not always exact and that’s why all the filed applications in the particular field are difficult to capture. But still the definitions are likely to capture major portion of applications filed under the particular technology domains. Some of the applications do not have IPC codes; hence those were not a part of the analysis.
The pie charts below represent country wise specialization index across some of the popular technology domains.

Following countries and authorities have been analyzed in further chapters of this report:
- United States (US)
- China (CN)
- France (FR)
- Great Britain (GB)
- Germany (DE)
- India (IN)
- Japan (JP)
- European Patent Office (EPO)
- World Intellectual Property Organization (WIPO)
Custom Patent Analytics Report
In order to meet different strategic needs , we can customize the report for you as per your company requirements.Fill the form by clicking here and our executive will get in touch with you.
-
CONTENTS
OVERVIEW………………………………….. 1
WORLDWIDE TRENDS (ALL AUTHORITIES)……………. 2
PATENT APPLICATION FILING TRENDS…………….. 2
GROWTH OF FILINGS ACROSS PATENT OFFICES………. 3
WORLDWIDE TECHNOLOGY DOMAIN DISTRIBUTION……… 5
FILINGS BY COUNTRY: UNITED STATES…………… 8
TOP APPLICANTS……………………………. 8
TOP RESIDENT APPLICANTS……………………. 9
TOP FOREIGN APPLICANTS…………………….. 11
DOMAIN-WISE DISTRIBUTION…………………… 12
US RECORD TYPE AND TERM EXTENSION INFORMATION… 16
ORGANIZATION-WISE DISTRIBUTION……………… 18
TOP FIVE FOREIGN UNIVERSITIES………………. 19
FILINGS BY COUNTRY: CHINA………………….. 20
TOP APPLICANTS……………………………. 20
TOP RESIDENT APPLICANTS……………………. 21
TOP FOREIGN APPLICANTS…………………….. 23
DOMAIN-WISE DISTRIBUTION…………………… 24
ORGANISATION-WISE DISTRIBUTION……………… 28
TOP TEN INSTITUTES………………………… 29
FILINGS BY COUNTRY: FRANCE…………………. 30
TOP APPLICANTS……………………………. 30
TOP RESIDENT APPLICANTS……………………. 31
TOP FOREIGN APPLICANTS…………………….. 33
DOMAIN-WISE DISTRIBUTION…………………… 34
ORGANISATION-WISE DISTRIBUTION……………… 38
TOP TEN UNIVERSITIES………………………. 39
FILINGS BY COUNTRY: GREAT BRITAIN…………… 40
TOP APPLICANTS……………………………. 40
TOP RESIDENT APPLICANTS……………………. 41
TOP FOREIGN APPLICANTS…………………….. 43
DOMAIN-WISE DISTRIBUTION…………………… 44
ORGANISATION-WISE DISTRIBUTION……………… 48
FILINGS BY COUNTRY: GERMANY………………… 50
TOP APPLICANTS……………………………. 50
TOP RESIDENT APPLICANTS……………………. 51
TOP FOREIGN APPLICANTS…………………….. 53
DOMAIN-WISE DISTRIBUTION…………………… 54
ORGANIZATION-WISE DISTRIBUTION……………… 58
TOP TEN FOREIGN UNIVERSITIES……………….. 59
FILINGS BY COUNTRY: INDIA………………….. 60
TOP APPLICANTS……………………………. 60
TOP RESIDENT APPLICANTS……………………. 61
TOP FOREIGN APPLICANTS…………………….. 63
DOMAIN-WISE DISTRIBUTION…………………… 64
ORGANISATION-WISE DISTRIBUTION……………… 68
FILINGS BY COUNTRY: JAPAN………………….. 71
TOP APPLICANTS……………………………. 71
DOMAIN-WISE DISTRIBUTION…………………… 72
ORGANISATION-WISE DISTRIBUTION……………… 76
FILINGS BY AUTHORITY: EUROPEAN PATENT OFFICE…. 78
TOP APPLICANTS AND APPLICATION TREND………… 78
DOMAIN-WISE DISTRIBUTION…………………… 82
FILINGS BY AUTHORITY: WIPO…………………. 89
TOP APPLICANTS & APPLICATION TREND………….. 89
TOP 10 COUNTRIES………………………….. 91
DOMAIN-WISE DISTRIBUTION…………………… 92
ORGANIZATION-WISE DISTRIBUTION……………… 95Custom Patent Analytics Report
In order to meet different strategic needs , we can customize the report for you as per your company requirements.Fill the form by clicking here and our executive will get in touch with you.
Request an updated report in the field of Probiotic for a fee.Fill the form by clicking here .
Worldwide patent application filing trends report