-
Introduction
Patent Landscape Report on Optogenetics analyzes research trends with a focus on Targeting Techniques, Sensors, Light Equipments, Actuators and Applications and also highlights the key Applicants involved in this space. All charts and patent analysis in this report have been prepared using PatSeer 360 and Pro.
This report is based on search strategy for Optogenetics space / technology, after Patent data curation from thousands of records, we come up with representative set of 3452 records (1728 families).
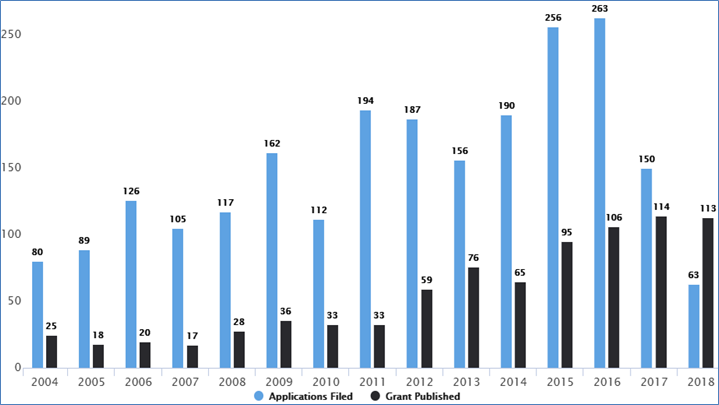
Trend analysis based on filing of priority application indicates a gradual increase in number of applications being filed after 2013.Maximum number of patent applications (263) taking/having priority were filed during 2016.
University of Stanford leads the patent count for Optogenetics followed by University of California and University of MIT.
More number of Universities and research originations in the top applicants with University of Stanford leading the record count.
University TUFTS has the highest Generality amongst the top universities innovating in optogenetics, which implies that it has multiple applications.
Though there are long gaps in the timeline from the early days, the recent years have continued to see a lot of IP activity.
Innovation Trends for Optogenetics
The chart below shows a number of filings and grants for optogenetics. The chart was generated on overall records (3452 Records) and the trend analysis is for the last 15 years.
Trend analysis based on the filing of priority application indicates a gradual increase in number of applications being filed post-2013. The maximum number of patent applications (236) taking/having priority were filed during 2016.

Top Applicants That Are Companies (Firms) and Their Quality AnalysisNEW
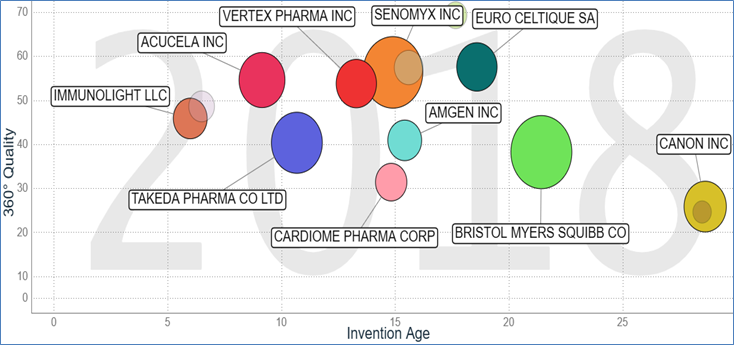
The chart below shows innovation summary for the top 10 applicants for optogenetics.
Bristol Myers has the largest portfolio but the overall invention age for its portfolio is more than 20 years.
While companies like Immunolight and Acucela have better 360 quality and their invention age is around 6 and 9 years respectively; which can be considered as being the new challengers in the field of optogenetics.

Research activity around the world
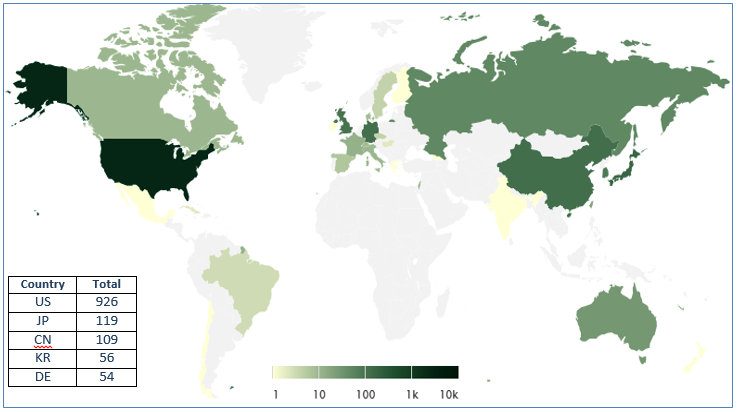
Map below represents the geographical filing relating to Optogenetics. The map helps provide an indication of where innovation in this area is originating from.
United States is the leading country in this field with 926 families followed by Japan (119) and China (109). The strength of the coloring represents the proportion of patent applications.

Custom Patent Analytic Report
In order to meet different strategic needs , we can customize the report for you as per your company requirements.
Fill the form by clicking here and our executive will get in touch with you.
Optogenetics – Overview ……………………………..2
Patent Search Strategy…….. 3
Technical Segmentation (Patent Categories)……. 4
Optogenetics: Trends
Innovation Trends ……… 5
Trend for Various Application Areas of Optogenetics Over the Last 15 Years …….. 6
Trend for Various Targeting Techniques of Optogenetics over the Last 15 Years …………..7
Inventions Abandoned and Renewed ……………8
Technology Cycle Time ………9
Optogenetics: Current Research Landscape
Key Areas of Research for Optogenetics
Key Areas of Research for Optogenetics …………..10
Research Activity around World…….. 10
Actuators across Different Types of Applications …11
Sensors across Different Types of Application ……..12
Top CPC Classifications ………13
Prominent Areas of Research …….14
Top Applicants* Portfolio Analysis (Quantitative)
Top Applicants – Portfolio Size and Quality ….16
Inventor Groups of Top Applicants for Optogenetics ….17
Portfolio Analysis Of Applicants Across Technical Segments …..18
Applicants across Different Types of Applications …..18
Applicants across Different Targeting Techniques ………..19
Applicants across Different Sensors ……………………20
Applicants across Different Light Equipments………………21
Applicants across Different Actuators …………………….22
Technology Landscape for Optogenetics ……………………. 23
Top Applicants Portfolio Analysis (Qualitative)
Top Applicants That Are Companies (Firms) and Their Quality Analysis………………………25
Innovation Summary of Top Applicants ……………………25
Top Applicants with Citation and Legal Quality …………………….26
Top Applicants That Are Universities (Univ.) and Their Quality Analysis……………………….27
Innovation Summary of Top Universities …………………….27
Top Universities and Their Research Caliber …………………….28
Top Universities Ranked By Originality ……………………. 28
New Entrants Portfolio Analysis (Quantitative)
New Entrants in the Last 5 Years …………………….31
Innovation Timeline for the New Entrants …………………….31
Innovations across Different Targeting Techniques for the New Entrants in Optogenetics …………………….32
Company Spotlight Wart New Entrants
New Entrants across Sensors …………………….33
New Entrants across Actuators …………………….34
New Entrants across Applications …………………….35
New Entrants Summary Report …………………….36
New Entrants Portfolio Analysis (Qualitative)
Innovation Summary of New Entrants in the Last 5 Years …………………….39
Summary …………………….40
PatSeer 360° Quality Scores …………………….41
About PatSeer …………………….43
About PatSeer 360 ……………………43
About PatSeer Pro ……………………43Custom Patent Analytic Report
In order to meet different strategic needs , we can customize the report for you as per your company requirements.
Fill the form by clicking here and our executive will get in touch with you.